Neutrons are generated by the beryllium after the absorption of an alpha particle emitted from the americium, with activity of 888 GBq. The source is composed by a cylindrical capsule containing the two elements, which is housed below the floor. It can be easily turned on/off in a few seconds and once activated is maintained in the middle of the irradiation room inside an aluminium pipe, by means of compressed air. This aspect allows an isotropic flux of 5.03×10⁷ [s-1/4π].
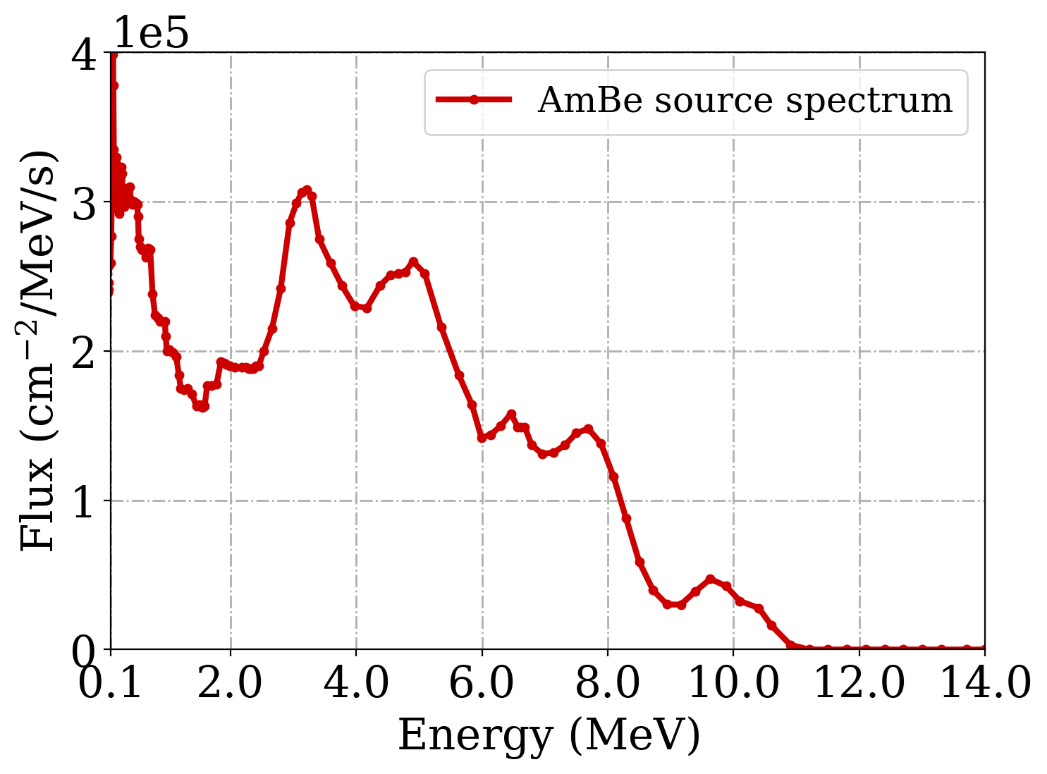
The source provides a spectrum with a peak around 3 MeV and reaches a maximum energy of about 10 MeV as shown in the FLUKA simulation of Figure 1.
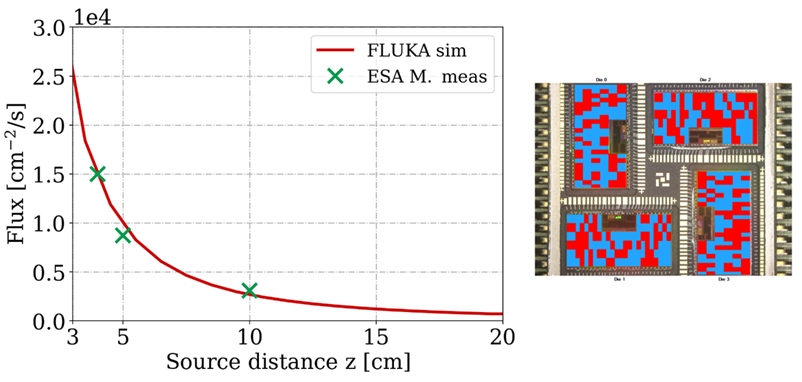
The ESA SEU Monitor (0.25 μm CMOS technology) is an SRAM-based detector calibrated in a broad set of facilities and used by the R2E project at CERN to cross validate the facility flux. In addition, it shows the beam homogeneity over its 20x20 mm2 of active surface, very well spread for the Am-Be source (see Figure 2).
The source and irradiation room were modelled through the Monte Carlo FLUKA tool in order to estimate the High Energy Hadron equivalent (HEHeq) flux of the source at the desired distance. The HEHeq is the neutron flux of the source, which is convoluted with the Weibull function of a typical SRAM memory in order to account for its response to the intermediate energy neutrons, typical of the Am-Be source. Table 1 reports the HEHeq flux of the ESA Monitor and the one retrieved considering the response function of a Toshiba 0.4 µm SRAM memory (EPJ Nuclear Sci Technol. 4, 1 (2018), R. G. Alìa et al., EDP Sciences, https://doi.org/10.1051/epjn/2017031).
Table 1. HEHeq fluxes at 5 cm from the center of the source.
|
5 cm distance |
ESA M. |
Toshiba |
|
HEHeq [cm-2 s-1] |
9.37×10³ |
1.84×10⁴ |
Tests with the ESA Monitor were performed in different positions with respect to the source center, with the aim of evaluating the flux attenuation (r-2 law) and compare these values with those from the simulations (see Figure 2). It has to be noted that the pipe diameter is of 6.4 cm, therefore the closest test position is at 3.2 cm from the source center. However, for practical reasons, tests are normally conducted at a minimum of 5 cm from it. The measurements resulted in agreement with the simulations within the experimental uncertainty of 15%.
From M. Cecchetto, "Experimental and Simulation Study of Neutron-Induced Single Event Effects in Accelerator Environment and Implications on Qualification Approach", PhD thesis, 2021. https://cds.cern.ch/record/2809556?ln=it